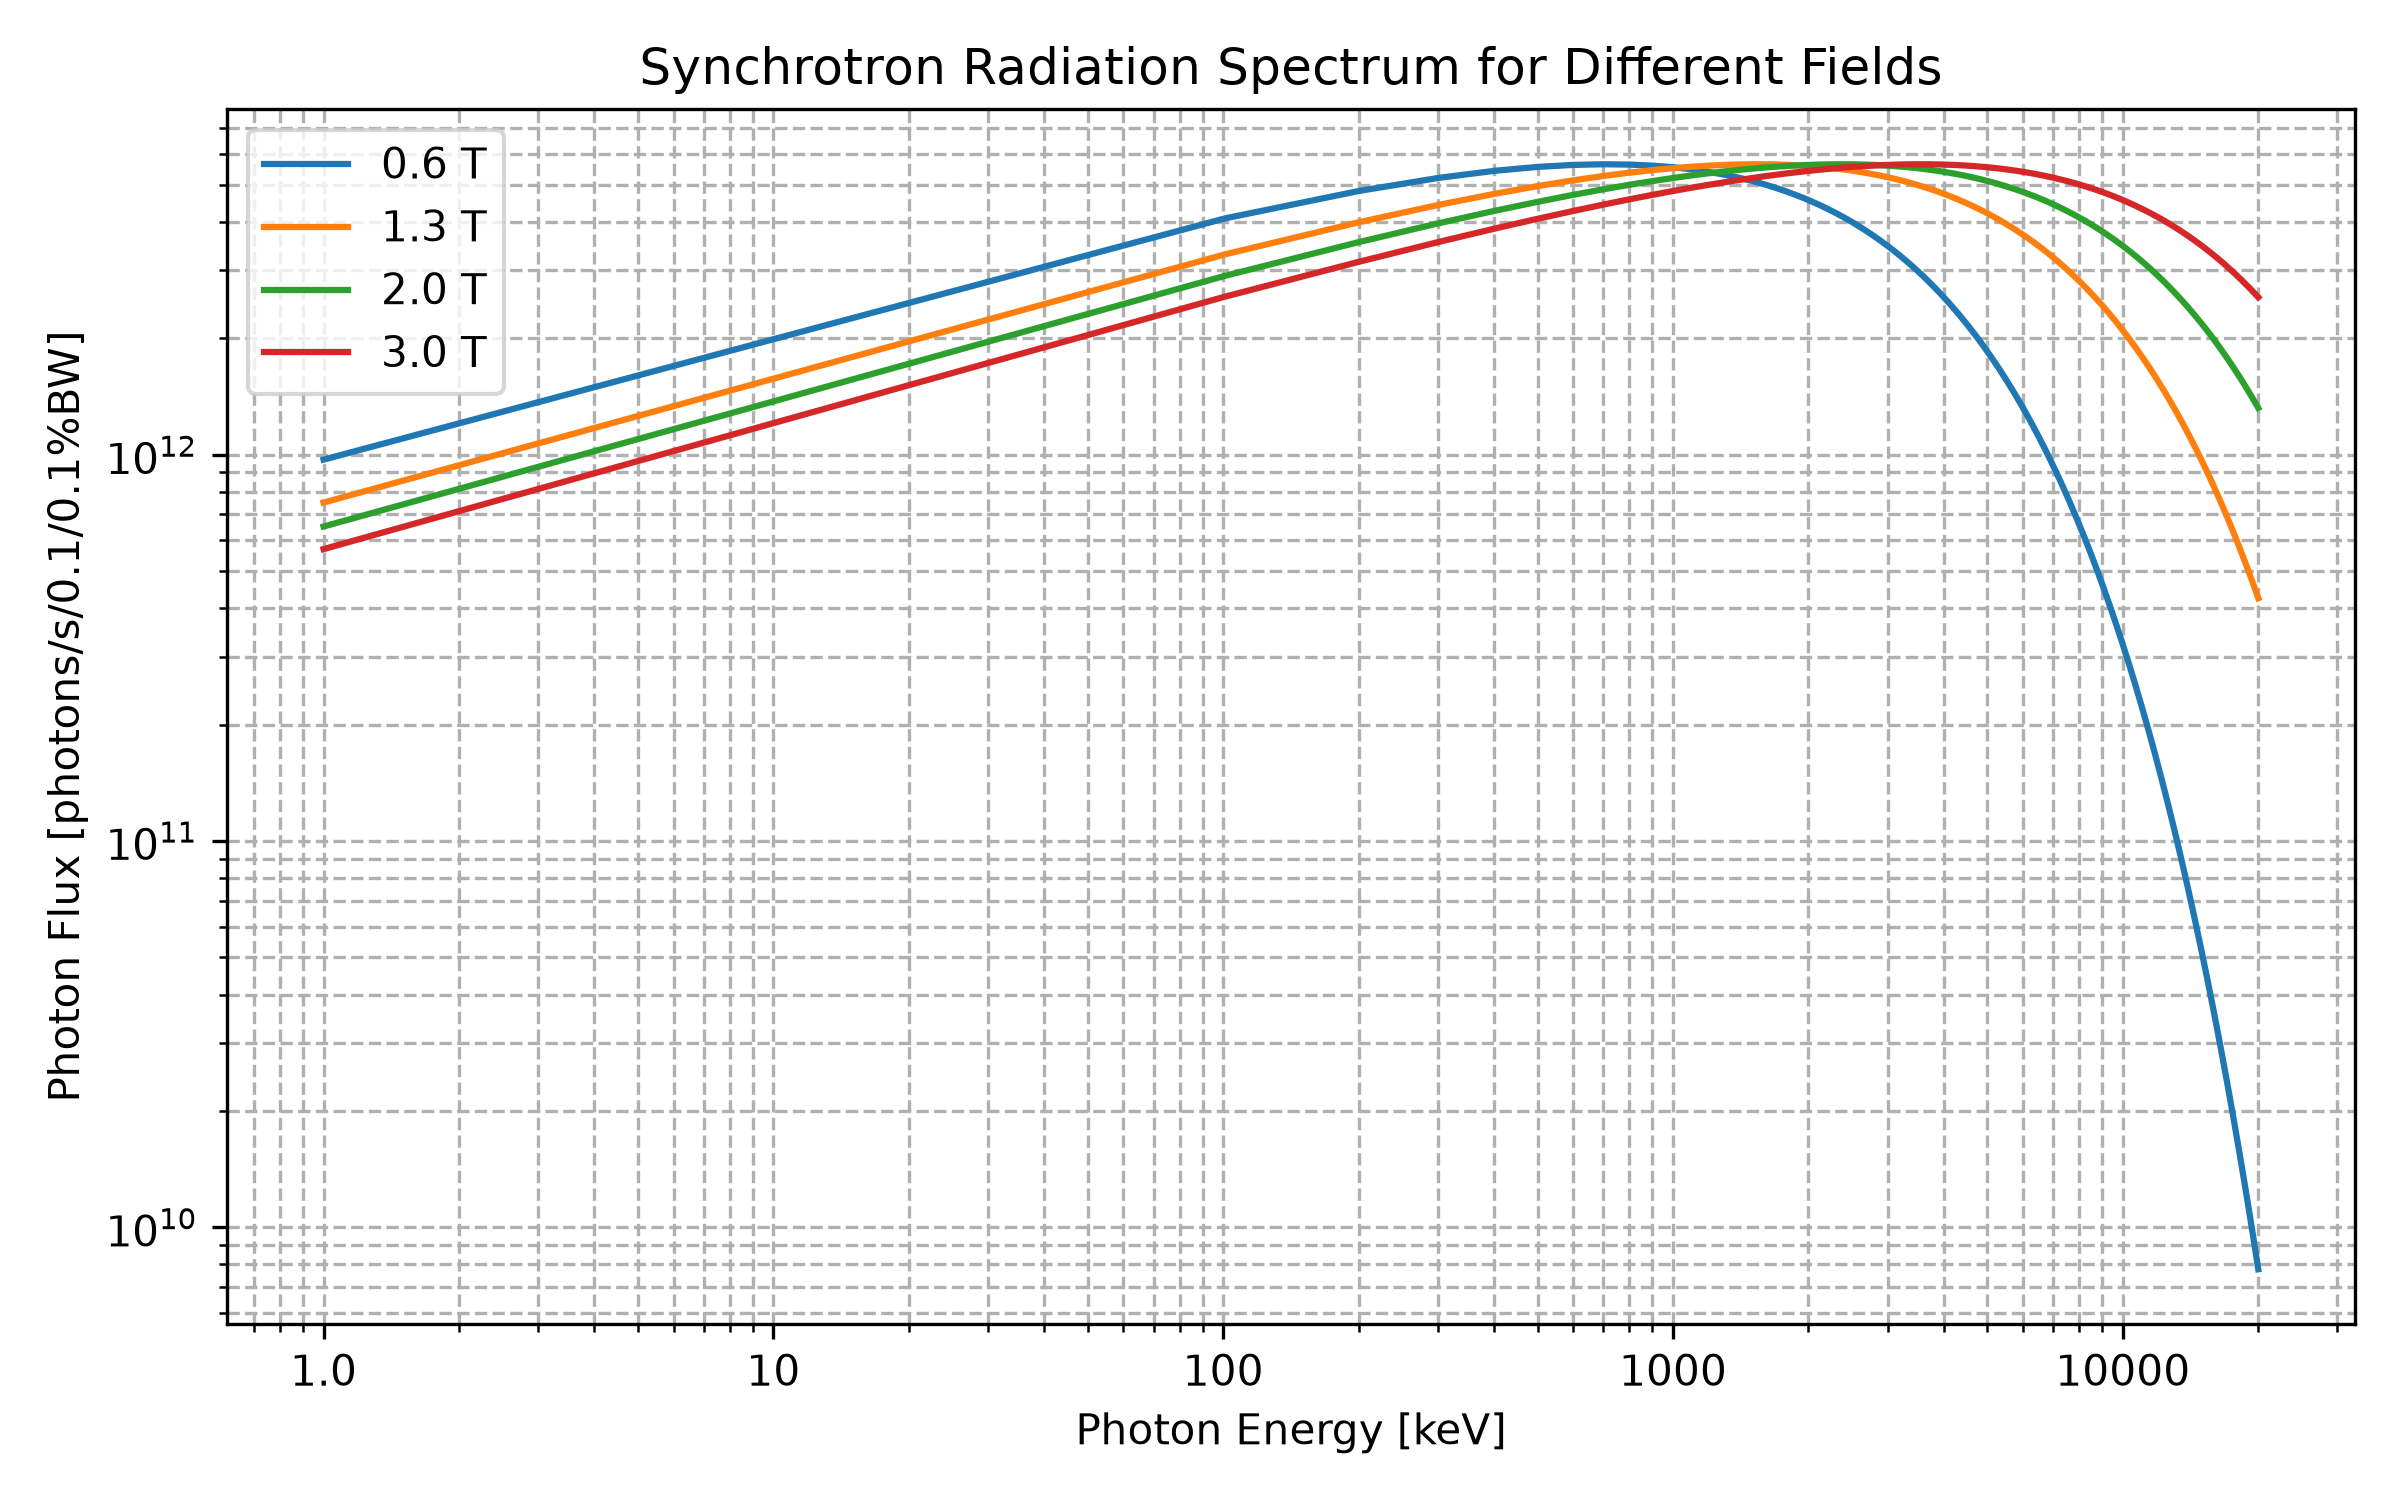
02 dipole demo
This is a low-level standalone example. It computes and plots the dipole source spectrum directly, without running a full beamline simulation.
import numpy as np

from raypyng import Dipole

# Magnetics fields of the dipole
# (one could also input the bending_radius_m)
magnetic_fields = np.array([0.6, 1.3, 2.0, 3.0])  # Tesla

energy_min  = 1     # eV
energy_max  = 20000 # eV
energy_step = 100  #  eV

energy_eV = np.arange(energy_min, energy_max + energy_step, energy_step)

dip = Dipole(magnetic_field_T=magnetic_fields,
            beam_energy_GeV=2.5,
            current_A=0.1)

# calculate the spectrum, returns the dipole in the given energy range
dipole_flux = dip.calculate_spectrum(energy_eV)

# print the Dipole(s) representation
print(dip)

dip.plot_spectrum(show=False, save_path='plot_dipole.png')
Result: